Install WSL and X Server
Install WSL
If the Windows Subsystem for Linux (WSL) is not yet installed on your Windows system, you can execute the following command on the CMD command prompt as Administrator:
wsl --install
As a default, Ubuntu will be installed. After inputting a username and password on a Ubuntu terminal, you may update and upgrade Ubuntu packages:
sudo apt update
sudo apt upgrade
sudo apt autoremove
Then you can create a directory and a Python file pyplot.py.
mkdir gnuplot
cd gnuplot
touch pyplot.py
And copy the following contents to pyplot.py.
# python3 pyplot.py

import matplotlib.pyplot as plt
import numpy as np

x = np.linspace(-0.5, 2.5, 301)
plt.plot(x, x*x - 2*x)
plt.show()
You may want to execute it as below immediately but the execution failed.
python3 pyplot.py

Traceback (most recent call last):
  File "pyplot.py", line 3, in
    import matplotlib.pyplot as plt
ModuleNotFoundError: No module named 'matplotlib'
You must install matplotlib first:
pip3 install matplotlib

Command 'pip3' not found, but can be installed with:

sudo apt install python3-pip
Install pip3:
sudo apt install python3-pip
Now, install matplotlib:
pip3 install matplotlib
plt.show() in pyplot.py requires an X window to show the figure, therefore we must install and start an X server.
Install X Server
If Cygwin/X is already installed on your PC, then start X on a Cygwin terminal:
xwin -multiwindow -listen tcp 2>/null &
Otherwise, you may install free VcXsrv, download it from https://sourceforge.net/projects/vcxsrv/, and install it. Then start Xlaunch and check "Disable access control", allowing anyone full access.
For using X server (Cygwin/X or VcXsrv), you must set $DISPLAY as below (WSL2 does not support localhost or 127.0.0.1):
export DISPLAY=$(route.exe print | grep 0.0.0.0 | head -1 | awk '{print $4}'):0.0
echo $DISPLAY
Execute as below, but the figure may not be shown:
python3 pyplot.py

pyplot.py:10: UserWarning: Matplotlib is currently using agg, which is a non-GUI backend, so cannot show the figure.
  plt.show()
To solve this problem, you may install python3-tk:
sudo apt install python3-tk
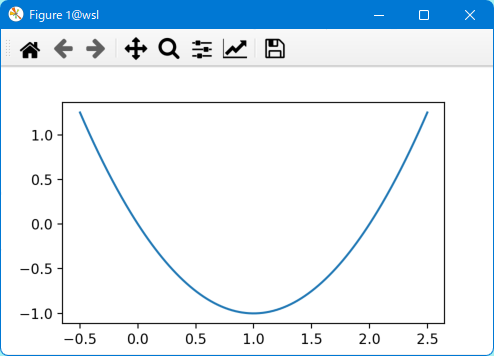
Then you can show the plot graph as below (Figure 1):
python3 pyplot.py
Congratulations.
Tips
You may use emacs to edit the pyplot.py file:
emacs pyplot.py &
You can use gnome-terminal for easy copy and paste with your mouse:
gnome-terminal
To open windows explorer from the current working directory of the WSL shell:
explorer.exe .
You can access the windows directories and files:
ls -l /mnt/c
To use full LaTeX, install full TeXLive:
sudo apt install texlive-full
...
0 upgraded, 346 newly installed, 0 to remove and 0 not upgraded.
Need to get 3011 MB of archives.
After this operation, 5692 MB of additional disk space will be used.
To check disk space the /usr/share/texlive uses:
du -h /usr/share/texlive/
...
2.6G	/usr/share/texlive/
To find the location of a file, execute "locate filename". For example:
locate beamer.cls
...
/usr/share/texlive/texmf-dist/tex/latex/beamer/beamer.cls
...
Below are the settings added to ~/.profile in my case.
#export DISPLAY=$(cat /etc/resolv.conf | grep nameserver | awk '{print $2}'):0.0
export DISPLAY=$(route.exe print | grep 0.0.0.0 | head -1 | awk '{print $4}'):0.0
export LIBGL_ALWAYS_INDIRECT=1
export NO_AT_BRIDGE=1
export XDG_RUNTIME_DIR=/tmp/runtime-$(whoami)
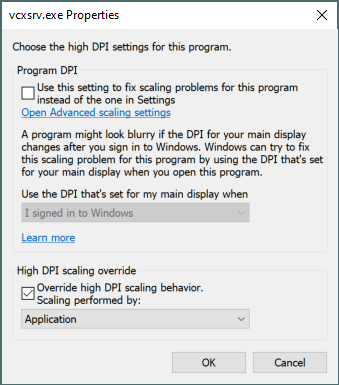
You may use high DPI fonts by checking "High DPI scaling override" through the compatibility of the properties of vcxsrv.exe and xlaunch.exe in C:\Program Files\VcXsrv. Note: You can add a compatibility tab to the properties page if there is no compatibility tab originally.
Problem
Problem: WSL2 can no longer use X and network after using VPN (Cisco AnyConnect Secure Mobility Client on Windows).
Solved: Download and install anyconnect from Windows Store. See here.
BTW, the Cygwin X terminal works well with either VPN. We can execute "ssh -Y ..." on the Cygwin X terminal.
Gnuplot Templates
Refer to Cygwin version.


