Basics of LaTeX
Steps of generating pdf with LaTeX:
- Using an editor, emacs for example, to prepare a .tex file.
- Executing platex and dvipdfmx commands in Cygwin (or a Linux terminal) to comple .tex and generate .pdf.
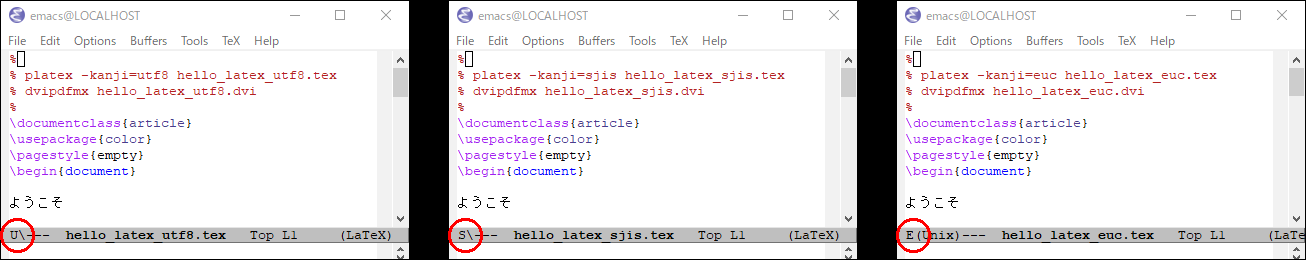
Compiling commands for different Japanese encodings:
- utf8 - hello_latex_utf8.tex
- sjis - hello_latex_sjis.tex
- euc - hello_latex_euc.tex
$ platex -kanji=utf8 hello_latex_utf8.tex
$ dvipdfmx hello_latex_utf8.dvi
$ platex -kanji=sjis hello_latex_sjis.tex
$ dvipdfmx hello_latex_sjis.dvi
$ platex -kanji=euc hello_latex_euc.tex
$ dvipdfmx hello_latex_euc.dvi
You can see the encodings U, S, and E in the left-bottom of emacs.
utf8 example: hello_latex_utf8.tex
1 2 3 4 5 6 7 8 9 10 11 12 13 14 15 16 17 18 19 20 21 22 23 24 25 26 27 28 29 30 31 32 33 34 35 36 37 38 39 40 41 42 43 44 45 46 47 48 49 50 51 52 53 54 55 56 57 58 59 60 61 62 63 64 65 66 67 68 69 70 71 72 73 74 75 76 77 78 79 80 81 82 83 84 85 86 87 88 89 90 |
% % platex -kanji=utf8 hello_latex_utf8.tex <-- tex to dvi % dvipdfmx hello_latex_utf8.dvi <-- dvi to pdf % \documentclass{article} \usepackage{color} \pagestyle{empty} \begin{document} ようこそ {\LaTeX} による文書作成 李 亜民 Hello, \LaTeX \vspace{2mm} Centering: \begin{center} ようこそ {\LaTeX} による文書作成 李 亜民 Hello, \LaTeX \end{center} \vspace{2mm} Fonts: \begin{center} ようこそ {\gtfamily{{\LaTeX} による文書作成}} 李 亜民 {\sf{Hello, \LaTeX}} \end{center} \vspace{2mm} Sizes: \begin{center} {\Huge{ようこそ}} \vspace{2mm} {\Large\gtfamily{{\LaTeX} による文書作成}} \vspace{2mm} {\LARGE{李 亜民}} \vspace{2mm} {\large\sf{Hello, \LaTeX}} \end{center} \vspace{2mm} Formula: {\huge $$\displaystyle \sum_{k=0}^{n-1}2^k= \ ?$$ } \vspace{2mm} Color: {\huge {\color{red} $$\displaystyle \sum_{k=0}^{n-1}2^k= \ ?$$ } } \end{document} |
Compile and generate pdf:
$ platex -kanji=utf8 hello_latex_utf8.tex
$ dvipdfmx hello_latex_utf8.dvi
Generated pdf:
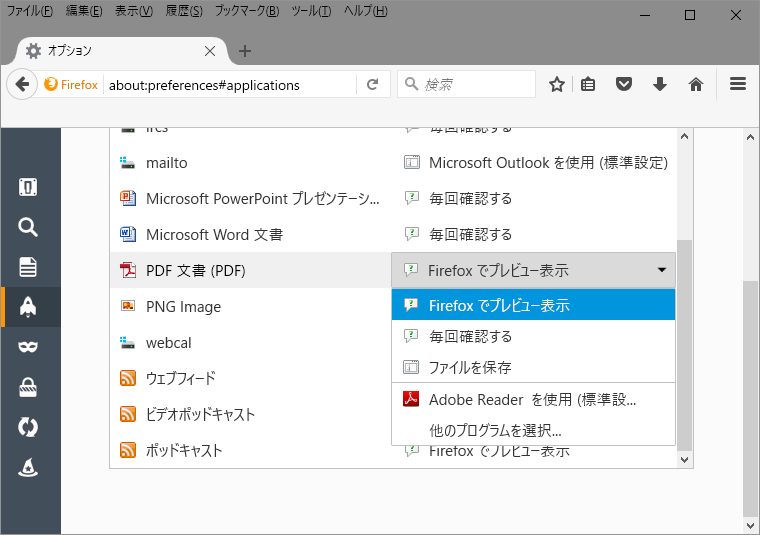
If no pdf showed here, please enable the pdf preview for your browser. The following shows the method for firefox.
LaTeX codes, symbols, and formulas
latex_formula.tex
1 2 3 4 5 6 7 8 9 10 11 12 13 14 15 16 17 18 19 20 21 22 23 24 25 26 27 28 29 30 31 32 33 34 35 36 37 38 39 40 41 42 43 44 45 46 47 48 49 50 51 52 53 54 55 56 57 |
%
% platex -kanji=utf8 latex_formula.tex
% dvipdfmx latex_formula.dvi
%
\documentclass{article}
\pagestyle{empty}
\begin{document}

\begin{enumerate}

\item You can write program codes like this:

\begin{verbatim}
/*
 * C program that says "Hello, World!" (hello_world.c)
 */
#include <stdio.h>    // needed to perform IO operations

int main() {                 // program entry point
  printf("Hello, World!\n"); // say Hello, World!
  return 0;                  // terminate main()
}                            // end of main function
\end{verbatim}

\item Symbols and formulas:

  $\sum_{k=0}^{n-1}2^k= \ ?$ and
  $\displaystyle \sum_{k=0}^{n-1}2^k= \ ?$

  Assume that the initial vertical velocity is 0 at time 0,
  and $g=9.8$ is the gravitational acceleration.
  The falling vertical velocity $v_y$ at time $t$ is

  $$v_y=gt$$

  The falling vertical distance $s$ at time $t$ is

  $$s=\int_0^tv_y\ dt=\int_0^tgt\ dt=\frac{1}{2}gt^2$$

  $$(x+y)^i=\sum_{j=0}^{i}\left(
  \begin{array}{c} i \\ j \end{array}
  \right)x^{i-j}y^{j}$$

  $$\left(\begin{array}{c} i \\ j \end{array} \right)
  = C_j^i = \,_iC_j = \frac{i!}{j!\,(i-j)!}$$

  $$\left(\begin{array}{c} i \\ j+1 \end{array} \right)
  = \frac{i!}{(j+1)!\,(i-(j+1))!}
  = \left( \begin{array}{c} i \\ j \end{array} \right)(i-j)\,/\,(j+1)$$

  $\left(\begin{array}{c} i \\ 0 \end{array} \right) = 1$,
  we can calculate $\left(\begin{array}{c} i \\ j+1 \end{array} \right)$
  from $\left(\begin{array}{c} i \\ j \end{array} \right)$
  for $j=0,1,\ldots,i$.

\end{enumerate}
\end{document}
|
Compile and generate pdf:
$ platex -kanji=utf8 latex_formula.tex
$ dvipdfmx latex_formula.dvi
Generated pdf:
LaTeX tables
1 2 3 4 5 6 7 8 9 10 11 12 13 14 15 16 17 18 19 20 21 22 23 24 25 26 27 28 29 30 31 32 33 34 35 36 37 38 39 40 41 42 43 44 45 46 47 48 49 50 51 52 53 54 55 56 57 58 59 60 61 |
%
% platex -kanji=utf8 latex_tables.tex
% dvipdfmx latex_tables.dvi
%
\documentclass{article}
\pagestyle{empty}
\begin{document}

Table.~\ref{align} shows an example of table.

\begin{table}[h!tb]
  \begin{center}
    \caption{Table example{\label{align}}}
    \begin{tabular}[t]{l|c|r}\hline
      left & center & right\\\hline
      lef  & cente  & righ \\\hline
      le   & cent   & rig  \\\hline
      l    & cen    & ri   \\\hline
    \end{tabular}
  \end{center}
\end{table}

Table.~\ref{alignment} shows another example of table.

\begin{table}[h!tb]
  \begin{center}
    \caption{Table example{\label{alignment}}}
    \begin{tabular}[t]{|l|c|r|}\hline
      left & center & right\\\hline\hline
      lef  & cente  & righ \\\hline
      le   & cent   & rig  \\\hline
      l    & cen    & ri   \\\hline
    \end{tabular}
  \end{center}
\end{table}

Table.~\ref{multiple} shows a table where ``hello2'' takes two columns.

\begin{table}[h!tb]
  \begin{center}
    \caption{Table example{\label{multiple}}}
    \begin{tabular}[t]{|l|c|r|}\hline
      \multicolumn{2}{|c|}{hello2} & right\\\hline\hline
      left & center & right\\\hline\hline
      lef  & cente  & righ \\\hline
      le   & cent   & rig  \\\hline
      l    & cen    & ri   \\\hline
    \end{tabular}
  \end{center}
\end{table}

A table without title:

\begin{tabular}[t]{|l|c|r|}\hline
  left & center & right\\\hline\hline
  lef  & cente  & righ \\\hline
  le   & cent   & rig  \\\hline
  l    & cen    & ri   \\\hline
\end{tabular}

\end{document}
|
Compile and generate pdf:
$ platex -kanji=utf8 latex_tables.tex
$ dvipdfmx latex_tables.dvi
Generated pdf:
Include figures to your LaTeX
Generate eps (vector-based) file
- Use tgif to draw a figure (obj and eps)
- Or use Adobe illustrator to generate eps file
- When you plot data to graph, use gnuplot
Screen-shot of tgif:
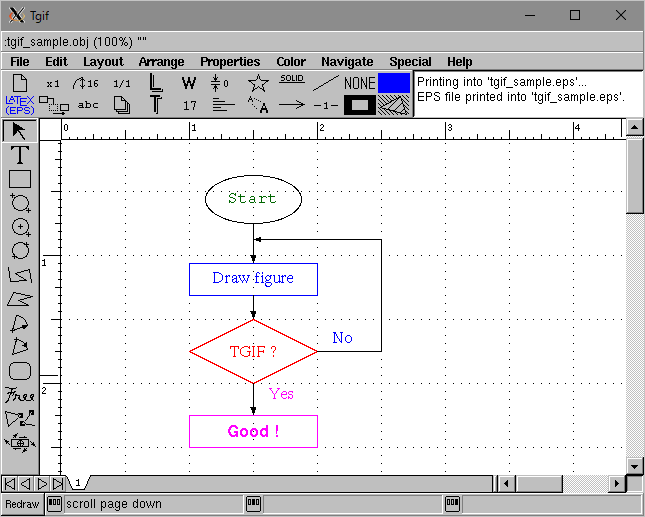
It generate an eps file. It is better to convert eps to pdf. Then, include pdf to tex:
1 2 3 4 5 6 7 8 9 10 11 12 13 14 15 16 17 18 19 20 21 22 23 24 25 26 27 28 29 30 31 32 33 34 35 36 37 38 39 40 41 42 43 44 45 46 47 48 49 50 51 52 53 54 55 56 57 58 59 60 61 62 63 64 65 |
% % platex -kanji=utf8 -shell-escape latex_figure.tex % dvipdfmx latex_figure.dvi % \documentclass{article} \usepackage[dvipdfmx]{graphicx} \pagestyle{empty} \begin{document} Figure~\ref{sample} shows an example of figure created with TGIF. Figure~\ref{sample} shows an example of figure created with TGIF. Figure~\ref{sample} shows an example of figure created with TGIF. Figure~\ref{sample} shows an example of figure created with TGIF. Figure~\ref{sample} shows an example of figure created with TGIF. \begin{figure}[h!tb] \begin{center} \includegraphics{figs/tgif_sample.pdf} \caption{Figure example{\label{sample}}} \end{center} \end{figure} Figure~\ref{tetris3d} shows another example of figure created with TGIF. Figure~\ref{tetris3d} shows another example of figure created with TGIF. Figure~\ref{tetris3d} shows another example of figure created with TGIF. Figure~\ref{tetris3d} shows another example of figure created with TGIF. Figure~\ref{tetris3d} shows another example of figure created with TGIF. \begin{figure}[h!tb] \begin{center} \includegraphics[width=0.92\textwidth]{figs/tetris3d.pdf} \caption{Blocks of 3D Tetris{\label{tetris3d}}} \end{center} \end{figure} Figure~\ref{connectivity} shows another example of figure created with gnuplot. Figure~\ref{connectivity} shows another example of figure created with gnuplot. Figure~\ref{connectivity} shows another example of figure created with gnuplot. Figure~\ref{connectivity} shows another example of figure created with gnuplot. Figure~\ref{connectivity} shows another example of figure created with gnuplot. Figure~\ref{connectivity} shows another example of figure created with gnuplot. Figure~\ref{connectivity} shows another example of figure created with gnuplot. Figure~\ref{connectivity} shows another example of figure created with gnuplot. Figure~\ref{connectivity} shows another example of figure created with gnuplot. \begin{figure}[h!tb] \begin{center} \includegraphics{figs/connectivity.pdf} \caption{Blocks of 3D Tetris{\label{connectivity}}} \end{center} \end{figure} Figure~\ref{connectivity} shows another example of figure created with gnuplot. Figure~\ref{connectivity} shows another example of figure created with gnuplot. Figure~\ref{connectivity} shows another example of figure created with gnuplot. Figure~\ref{connectivity} shows another example of figure created with gnuplot. Figure~\ref{connectivity} shows another example of figure created with gnuplot. Figure~\ref{connectivity} shows another example of figure created with gnuplot. Figure~\ref{connectivity} shows another example of figure created with gnuplot. Figure~\ref{connectivity} shows another example of figure created with gnuplot. Figure~\ref{connectivity} shows another example of figure created with gnuplot. Figure~\ref{connectivity} shows another example of figure created with gnuplot. \end{document} |
Compile and generate pdf:
$ platex -kanji=utf8 -shell-escape latex_figure.tex
$ dvipdfmx latex_figure.dvi
Generated pdf:
Download figures and put them in the figs folder.
tgif_sample.obj; open it with tgif
tgif_sample.eps; generated by tgif

tetris3d.obj; open it with tgif
tetris3d.eps; generated by tgif

connectivity.gnu; compile it with gnuplot, see next section
results.txt; data file for connectivity.gnu
connectivity.eps; generated by gnuplot
The epstopdf command converts eps to pdf:
$ epstopdf tgif_sample.eps
$ epstopdf tetris3d.eps
$ epstopdf connectivity.eps
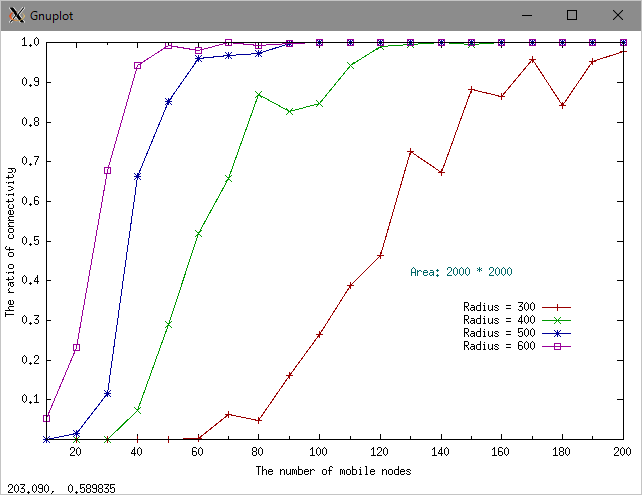
Plot vectored graph with gnuplot
The following gnu reads results.txt (data) and plots the data with curves.
1 2 3 4 5 6 7 8 9 10 11 12 13 14 15 16 17 18 19 20 21 22 23 24 25 26 27 28 29 30 31 32 |
# # gnuplot connectivity.gnu # set xlabel "The number of mobile nodes" set ylabel "The ratio of connectivity" set format x "%g" set format y "%1.1f" set xrange [10:200] set yrange [0:1.0] set xtics 20, 20, 200 set ytics 0.1, 0.1, 1.0 set mxtics 2 set key at 185, 0.35 set border linewidth .5 linecolor rgb '#000000' #set tics scale 0.75 set style line 1 lt rgb "#990000" lw 1 set style line 2 lt rgb "#009900" lw 1 set style line 3 lt rgb "#000099" lw 1 set style line 4 lt rgb "#990099" lw 1 set label "Area: 2000 * 2000" at 130.4, 0.42 textcolor rgb "#006666" font "Helvetic, 16" plot 'results.txt' using 1:2 title "Radius = 300" with linespoints ls 1, \ 'results.txt' using 1:3 title "Radius = 400" with linespoints ls 2, \ 'results.txt' using 1:4 title "Radius = 500" with linespoints ls 3, \ 'results.txt' using 1:5 title "Radius = 600" with linespoints ls 4 pause -1 "Type return to continue" set size 0.97, 1.0 set terminal postscript eps enhanced color font 'Helvetica,16' set output "connectivity.eps" replot |
results.txt:
 #N   r=0.3   r=0.4   r=0.5   r=0.6
 10   0.000   0.000   0.000   0.052
 20   0.000   0.000   0.015   0.233
 30   0.000   0.000   0.116   0.678
 40   0.000   0.073   0.664   0.944
 50   0.000   0.289   0.851   0.993
 60   0.001   0.520   0.961   0.981
 70   0.064   0.659   0.968   1.000
 80   0.047   0.869   0.972   0.994
 90   0.161   0.828   0.999   0.999
100   0.265   0.847   1.000   1.000
110   0.389   0.943   1.000   1.000
120   0.464   0.990   1.000   1.000
130   0.726   0.996   1.000   1.000
140   0.673   1.000   1.000   1.000
150   0.883   0.996   1.000   1.000
160   0.864   1.000   1.000   1.000
170   0.957   1.000   1.000   1.000
180   0.843   1.000   1.000   1.000
190   0.952   1.000   1.000   1.000
200   0.979   1.000   1.000   1.000
Compile and generate eps:
$ gnuplot connectivity.gnu
Type return to continue
It will generate connectivity.eps.
Using IPA fonts and embedding fonts into pdf
If you are in ubuntu and installed TexLive, you can do
sudo kanji-config-updmap -sys ipa
or
sudo kanji-config-updmap -sys ipaex
Otherwise, do the followings.
Click here to download IPA fonts: ipam.ttf (true-type mincho font) and ipag.ttf (true-type gothic font), and put them in /usr/share/fonts/:
$ ls /usr/share/fonts/ipa-*
/usr/share/fonts/ipa-gothic:
ipag.ttf

/usr/share/fonts/ipa-mincho:
ipam.ttf
Use IPA fonts to generate pdf:
$ dvipdfmx -f ./texfonts.map hello_latex_utf8.dvi
The contents of texfonts.map:
rml  H :0:ipam.ttf
gbm  H :0:ipag.ttf
rmlv V :0:ipam.ttf
gbmv V :0:ipag.ttf
Generated pdf:
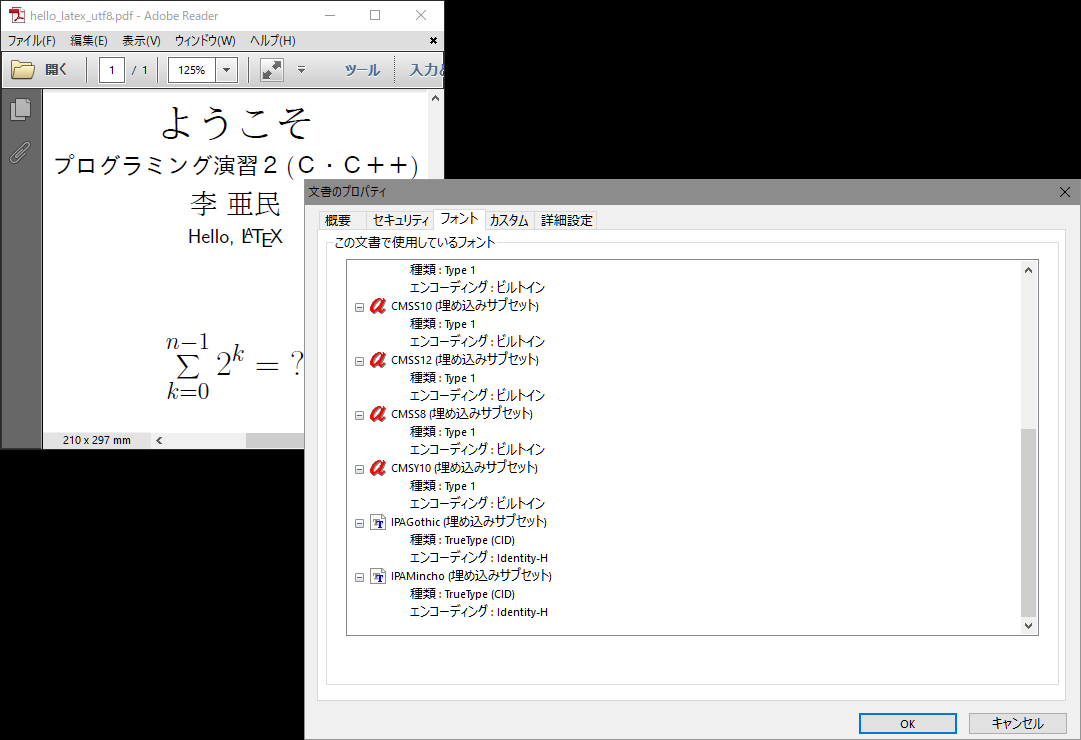
The pdffonts command checks the pdf fonts. You can see that the IPA fonts are emdedded in the pdf.
$ pdffonts hello_latex_utf8.pdf
name                                 type              encoding         emb sub uni object ID
------------------------------------ ----------------- ---------------- --- --- --- ---------
HXGJXE+IPAMincho                     CID TrueType      Identity-H       yes yes no       5  0
CZZTSO+CMR10                         Type 1C           Builtin          yes yes no       6  0
DSYLZD+CMR7                          Type 1C           Builtin          yes yes no       7  0
HNPHQZ+IPAGothic                     CID TrueType      Identity-H       yes yes no       9  0
BDCOLT+CMSS10                        Type 1C           Builtin          yes yes no      10  0
JDYPCL+CMSS8                         Type 1C           Builtin          yes yes no      11  0
WXXASS+CMR12                         Type 1C           Builtin          yes yes no      12  0
EXYBTB+CMSS12                        Type 1C           Builtin          yes yes no      13  0
YGGCRX+CMMI12                        Type 1C           Builtin          yes yes no      14  0
SLTHGY+CMSY10                        Type 1C           Builtin          yes yes no      15  0
HYIHVA+CMEX10                        Type 1C           Builtin          yes yes yes     16  0
COBJBH+CMR17                         Type 1C           Builtin          yes yes no      17  0
Or you can check fonts with properties in an opened pdf.
Title, author, abstract, sections, and references
1 2 3 4 5 6 7 8 9 10 11 12 13 14 15 16 17 18 19 20 21 22 23 24 25 26 27 28 29 30 31 32 33 34 35 36 37 38 39 40 41 42 43 44 45 46 47 48 49 50 51 52 53 54 55 56 57 58 59 60 61 62 63 64 65 66 67 68 69 70 71 72 73 74 75 76 77 78 79 80 81 82 83 84 85 86 87 88 89 90 91 92 93 94 95 96 97 98 99 100 101 102 103 104 105 106 107 108 109 110 111 112 113 114 115 116 117 118 119 120 121 122 123 124 125 126 127 128 129 130 131 132 133 134 135 136 137 138 139 140 141 142 143 144 145 146 147 148 149 150 151 152 153 154 155 156 157 158 159 160 161 162 163 164 165 166 167 168 169 170 171 172 173 174 175 176 177 178 |
% % platex -kanji=utf8 -shell-escape latex_report.tex % pbibtex latex_report % platex -kanji=utf8 -shell-escape latex_report.tex % platex -kanji=utf8 -shell-escape latex_report.tex % dvipdfmx -f ./texfonts.map latex_report.dvi % pdffonts latex_report.pdf % \documentclass{article} \usepackage[dvipdfmx]{graphicx} \date{\empty} \renewcommand\tablename{表} \renewcommand\figurename{図} \renewcommand\refname{参考文献} \title{{\LaTeX} による文書作成} \author{法政\,CIS\,太郎\\ \ \\ 法政大学 情報科学部 コンピュータ科学科ディジタルメディア学科\\ Email: tarou.cis.hosei.zz@stu.hosei.ac.jp } \begin{document} \maketitle \begin{abstract} 摘要摘要摘要摘要摘要摘要摘要摘要摘要摘要摘要摘要摘要摘要摘要摘要 摘要摘要摘要摘要摘要摘要摘要摘要摘要摘要摘要摘要摘要摘要摘要摘要 摘要摘要摘要摘要摘要摘要摘要摘要摘要摘要摘要摘要摘要摘要摘要摘要 摘要摘要摘要摘要摘要摘要摘要摘要摘要摘要摘要摘要摘要摘要摘要摘要 摘要摘要摘要摘要摘要摘要摘要摘要摘要摘要摘要摘要摘要摘要摘要摘要 摘要摘要摘要摘要摘要摘要摘要摘要摘要摘要摘要摘要摘要摘要摘要。 \end{abstract} \section{プログラムコード} You can write program codes like this, this, this, this, this, this, and this: \begin{verbatim} /* * C program that says "Hello, World!" (hello_world.c) */ #include <stdio.h> // needed to perform IO operations int main() { // program entry point printf("Hello, World!\n"); // say Hello, World! return 0; // terminate main() } // end of main function \end{verbatim} \section{図表図表図表図表図表図表図表図表 (Section)} \subsection{表表表表表表表表 (Sub-section)} Table~\ref{align} shows an example of table. Table~\ref{align} shows an example of table. Table~\ref{align} shows an example of table. Table~\ref{align} shows an example of table. Table~\ref{align} shows an example of table. Table~\ref{align} shows an example of table. 新しい段落。Table~\ref{multiple} shows a table where ``hello2'' takes two columns. Table~\ref{multiple} shows a table where ``hello2'' takes two columns. Table~\ref{multiple} shows a table where ``hello2'' takes two columns. Table~\ref{multiple} shows a table where ``hello2'' takes two columns. Table~\ref{multiple} shows a table where ``hello2'' takes two columns. \begingroup \renewcommand{\arraystretch}{1.3} \setlength{\tabcolsep}{30pt} \begin{table}[h!tb] \begin{center} \caption{Table example{\label{align}}} \begin{tabular}[t]{l|c|r}\hline left left & center center & right right\\\hline lef lef & cente cente & righ righ \\\hline le le & cent cent & rig rig \\\hline l l & cen cen & ri ri \\\hline \end{tabular} \end{center} \end{table} \endgroup \begingroup \renewcommand{\arraystretch}{1.3} \setlength{\tabcolsep}{35pt} \begin{table}[h!tb] \begin{center} \caption{Table example{\label{multiple}}} \begin{tabular}[t]{l|c|r}\hline \multicolumn{2}{c|}{hello2} & right right\\\hline\hline lef lef & cente cente & righ righ \\\hline le le & cent cent & rig rig \\\hline l l & cen cen & ri ri \\\hline \end{tabular} \end{center} \end{table} \endgroup \subsection{図図図図図図図図 (Sub-section)} Figure~\ref{sample} shows an example of figure created with TGIF~\cite{OLSR}. Figure~\ref{sample} shows an example of figure created with TGIF~\cite{DSDV}. Figure~\ref{sample} shows an example of figure created with TGIF. Figure~\ref{sample} shows an example of figure created with TGIF. \begin{figure}[h!tb] \begin{center} \includegraphics{figs/tgif_sample.pdf} \caption{Figure example generated with tgif{\label{sample}}} \end{center} \end{figure} Figure~\ref{tetris3d} shows another example of figure created with TGIF. Figure~\ref{tetris3d} shows another example of figure created with TGIF. Figure~\ref{tetris3d} shows another example of figure created with TGIF. \begin{figure}[h!tb] \begin{center} \includegraphics[width=1.01\textwidth]{figs/tetris3d.pdf} \caption{Blocks of 3D Tetris{\label{tetris3d}}} \end{center} \end{figure} Figure~\ref{connectivity} shows another example of figure created with gnuplot. Figure~\ref{connectivity} shows another example of figure created with gnuplot. \begin{figure}[h!tb] \begin{center} \includegraphics{figs/connectivity.pdf} \caption{MANET connectivity{\label{connectivity}}} \end{center} \end{figure} Figure~\ref{connectivity} shows another example of figure created with gnuplot. Figure~\ref{connectivity} shows another example of figure created with gnuplot. Figure~\ref{connectivity} shows another example of figure created with gnuplot. Figure~\ref{connectivity} shows another example of figure created with gnuplot. Figure~\ref{connectivity} shows another example of figure created with gnuplot. Figure~\ref{connectivity} shows another example of figure created with gnuplot. \section{物体は地面に向かって落下する --- 重力加速度} Assume that the initial vertical velocity is 0 at time 0, and $g=9.8$ is the gravitational acceleration. The falling vertical velocity $v_y$ at time $t$ is $$v_y=gt$$ \noindent The falling vertical distance $s$ at time $t$ is $$s=\int_0^tv_y\ dt=\int_0^tgt\ dt=\frac{1}{2}gt^2$$ \section{二項定理} $$(x+y)^i=\sum_{j=0}^{i}\left( \begin{array}{c} i \\ j \end{array} \right)x^{i-j}y^{j}$$ $$\left(\begin{array}{c} i \\ j \end{array} \right) = C_j^i = \,_iC_j = \frac{i!}{j!\,(i-j)!}$$ \section{結び} 結論結論結論結論結論結論結論結論結論結論結論結論結論結論結論結論 結論結論結論結論結論結論結論結論結論結論結論結論結論結論結論結論 結論結論結論結論結論結論結論結論結論結論結論結論結論結論結論結論 結論結論結論結論結論。 新しい段落新しい段落新しい段落新しい段落新しい段落新しい段落新しい段落 新しい段落新しい段落新しい段落新しい段落新しい段落新しい段落新しい段落 新しい段落新しい段落新しい段落新しい段落新しい段落新しい段落。 \bibliographystyle{plain} % references style \bibliography{refs} % needs refs.bib \end{document} |
refs.bib:
1 2 3 4 5 6 7 8 9 10 11 12 13 14 15 16 17 18 19 20 |
@article{DSDV,
  title={Highly dynamic destination-sequenced distance-vector
  routing (DSDV) for mobile computers},
  author={Charles E. Perkins and Pravin Bhagwat},
  journal={ACM SIGCOMM computer communication review},
  volume={24},
  number={4},
  pages={234--244},
  year={1994}
}

@inproceedings{OLSR,
  title={Optimized link state routing protocol for ad hoc networks},
  author={Jacquet, Philippe and M{\"u}hlethaler, Paul and Clausen,
  Thomas and Laouiti, Anis and Qayyum, Amir and Viennot, Laurent},
  booktitle={Multi Topic Conference, 2001. IEEE INMIC 2001.
  Technology for the 21st Century. Proceedings. IEEE International},
  pages={62--68},
  year={2001}
}
|
Compile and generate pdf:
$ platex -kanji=utf8 -shell-escape latex_report.tex
$ pbibtex latex_report
$ platex -kanji=utf8 -shell-escape latex_report.tex
$ platex -kanji=utf8 -shell-escape latex_report.tex
$ dvipdfmx latex_report.dvi
IEEE proceedings format
Click IEEE conference paper format to see a conference paper in IEEE Xplore. Note: To see the pdf, you should access this URL in the campus, or visit it through Hosei VPN (virtual private network). The figures in the paper were drawn with tgif and the graphs were generated with gnuplot.
Extended Abstract format of your graduation research
The CIS graduation research Extended Abstract follows the IEEE Computer Society Proceedings format. There are mainly two files we must use. One is the class file IEEEtran.cls, and the other is the reference format file IEEEtran.bst.
1 2 3 4 5 6 7 8 9 10 11 12 13 14 15 16 17 18 19 20 21 22 23 24 25 26 27 28 29 30 31 32 33 34 35 36 37 38 39 40 41 42 43 44 45 46 47 48 49 50 51 52 53 54 55 56 57 58 59 60 61 62 63 64 65 66 67 68 69 70 71 72 73 74 75 76 77 78 79 80 81 82 83 84 85 86 87 88 89 90 91 92 93 94 95 96 97 98 99 100 101 102 103 104 105 106 107 108 109 110 111 112 113 114 115 116 117 118 119 120 121 122 123 124 125 126 127 128 129 130 131 132 133 134 135 136 137 138 139 140 141 142 143 144 145 146 147 148 149 150 151 152 153 154 155 156 157 158 159 160 161 162 163 164 165 166 167 168 169 170 171 172 173 174 175 176 177 178 179 180 181 182 183 184 185 186 187 188 189 190 191 192 193 194 195 196 197 198 199 200 201 202 203 204 205 206 207 208 209 210 211 212 213 |
% % CIS Extended Abstract Sample (IEEE CS Proceedings Format) % Usage: % % platex -kanji=utf8 -shell-escape extended_abstract.tex % pbibtex extended_abstract % platex -kanji=utf8 -shell-escape extended_abstract.tex % platex -kanji=utf8 -shell-escape extended_abstract.tex % dvipdfmx -f ./texfonts.map extended_abstract.dvi % pdffonts extended_abstract.pdf % % other encodings: % platex -kanji=euc my_thesis_abs.tex % platex -kanji=sjis my_thesis_abs.tex \documentclass[a4paper,conference,compsoc]{IEEEtran} % do not modify this line \usepackage[dvipdfmx]{graphicx} \renewcommand\tablename{表} \renewcommand\figurename{図} \renewcommand\refname{参考文献} \IEEEoverridecommandlockouts \def\footnoterule{\hrule width 34mm \kern4.6pt} \begin{document} \title{\vskip-10mm\mdseries\mcfamily % do not modify this line %%%% put the paper title here 法政大学情報科学部卒業論文$\cdot$大学院情報科学研究科修士論文$\cdot$抄録フォーマット %%%% \vspace{-3mm}} % do not modify this line \author{ %%%% put your name, university department/graduate school, and supervisor here \IEEEauthorblockN{\normalfont 法政\,CIS\,太郎 \IEEEauthorrefmark{1}\\Tarou CIS Hosei\\} \IEEEauthorblockA{\normalfont 法政大学 情報科学研究科 情報科学専攻 情報科学部 コンピュータ科学科 ディジタルメディア学科\\ Email: tarou.cis.hosei.zz@stu.hosei.ac.jp} \thanks{\normalfont\IEEEauthorrefmark{1} Supervisor: Prof. A. Someone} %%%% \vspace{-4mm}} % do not modify this line \maketitle \begin{abstract} English English English English English English English English English English English English English English English English \end{abstract} \section{プログラムコード} You can write program codes like this, this, this, this, this, this, and this: \begin{verbatim} /* * C program that says "Hello, World!" */ #include <stdio.h> int main() { printf("Hello, World!\n"); return 0; } \end{verbatim} \section{図表図表図表図表図表図表 (Section)} \subsection{表表表表表表表表 (Sub-section)} Table~\ref{align} shows an example of table. Table~\ref{align} shows an example of table. Table~\ref{align} shows an example of table. Table~\ref{align} shows an example of table. Table~\ref{align} shows an example of table. Table~\ref{align} shows an example of table. \begingroup \renewcommand{\arraystretch}{1.3} \setlength{\tabcolsep}{22pt} \begin{table}[h!tb] \begin{center} \caption{Table example{\label{align}}} \begin{tabular}[t]{l|c|r}\hline left left & center center & right right\\\hline lef lef & cente cente & righ righ \\\hline le le & cent cent & rig rig \\\hline l l & cen cen & ri ri \\\hline \end{tabular} \end{center} \end{table} \endgroup \begingroup \renewcommand{\arraystretch}{1.3} \setlength{\tabcolsep}{23pt} \begin{table}[h!tb] \begin{center} \caption{Table example{\label{multiple}}} \begin{tabular}[t]{l|c|r}\hline \multicolumn{2}{c|}{hello2} & right right\\\hline\hline lef lef & cente cente & righ righ \\\hline le le & cent cent & rig rig \\\hline l l & cen cen & ri ri \\\hline \end{tabular} \end{center} \end{table} \endgroup 新しい段落。Table~\ref{multiple} shows a table where ``hello2'' takes two columns. Table~\ref{multiple} shows a table where ``hello2'' takes two columns. Table~\ref{multiple} shows a table where ``hello2'' takes two columns. Table~\ref{multiple} shows a table where ``hello2'' takes two columns. Table~\ref{multiple} shows a table where ``hello2'' takes two columns. \subsection{図図図図図図図図 (Sub-section)} Figure~\ref{sample} shows an example of figure created with TGIF~\cite{OLSR}. Figure~\ref{sample} shows an example of figure created with TGIF~\cite{DSDV}. Figure~\ref{sample} shows an example of figure created with TGIF. Figure~\ref{sample} shows an example of figure created with TGIF. \begin{figure}[!hb] \begin{center} \includegraphics{figs/tgif_sample.pdf} \caption{Figure example generated with tgif{\label{sample}}} \end{center} \end{figure} Figure~\ref{tetris3d} shows another example of figure created with TGIF. Figure~\ref{tetris3d} shows another example of figure created with TGIF. Figure~\ref{tetris3d} shows another example of figure created with TGIF. \begin{figure*}[t!b] \begin{center} \includegraphics[width=.99\textwidth]{figs/tetris3d.pdf} \caption{Blocks of 3D Tetris{\label{tetris3d}}} \end{center} \end{figure*} Figure~\ref{connectivity} shows another example of figure created with gnuplot. Figure~\ref{connectivity} shows another example of figure created with gnuplot. \begin{figure}[h!tb] \begin{center} \includegraphics[width=\columnwidth]{figs/connectivity.pdf} \caption{MANET connectivity{\label{connectivity}}} \end{center} \end{figure} Figure~\ref{connectivity} shows another example of figure created with gnuplot. Figure~\ref{connectivity} shows another example of figure created with gnuplot. Figure~\ref{connectivity} shows another example of figure created with gnuplot. Figure~\ref{connectivity} shows another example of figure created with gnuplot. Figure~\ref{connectivity} shows another example of figure created with gnuplot. Figure~\ref{connectivity} shows another example of figure created with gnuplot. \section{物体は地面に向かって落下する} Assume that the initial vertical velocity is 0 at time 0, and $g=9.8$ is the gravitational acceleration. The falling vertical velocity $v_y$ at time $t$ is $$v_y=gt$$ \noindent The falling vertical distance $s$ at time $t$ is $$s=\int_0^tv_y\ dt=\int_0^tgt\ dt=\frac{1}{2}gt^2$$ \section{二項定理} $$(x+y)^i=\sum_{j=0}^{i}\left( \begin{array}{c} i \\ j \end{array} \right)x^{i-j}y^{j}$$ $$\left(\begin{array}{c} i \\ j \end{array} \right) = C_j^i = \,_iC_j = \frac{i!}{j!\,(i-j)!}$$ \section{Merge Sort} Merge sort can be done by divide-and-conquer algorithm. To sort a subarray array[p..r], the merge sort uses divide-and-conquer as follows: \begin{enumerate} \item Divide by finding the number q of the position midway between p and r. Do this step the same way we found the midpoint in binary search: add p and r, divide by 2, and round down. \item Conquer by recursively sorting the subarrays in each of the two subproblems created by the divide step. That is, recursively sort the subarray array[p..q] and recursively sort the subarray array[q+1..r]. \item Combine by merging the two sorted subarrays back into the single sorted subarray array[p..r]. \end{enumerate} An example of merge sort is shown in Figure~\ref{merge-sort-example}. \begin{figure}[h!tb] \begin{center} \includegraphics[width=\columnwidth]{figs/merge-sort-example.pdf} \caption{An example of merge sort{\label{merge-sort-example}}} \end{center} \end{figure} \section{結び} 結論結論結論結論結論結論結論結論結論結論結論結論結論結論結論結論 結論結論結論結論結論結論結論結論結論結論結論結論結論結論結論結論 \bibliographystyle{IEEEtran} % references style \bibliography{refs} % needs refs.bib \end{document} |
Download figures and put them in the figs folder.
merge-sort-example.obj; open it with tgif
merge-sort-example.eps; generated by tgif
The epstopdf command converts eps to pdf:
$ epstopdf merge-sort-example.eps
Compile and generate pdf:
$ platex -kanji=utf8 -shell-escape extended_abstract.tex
$ pbibtex extended_abstract
$ platex -kanji=utf8 -shell-escape extended_abstract.tex
$ platex -kanji=utf8 -shell-escape extended_abstract.tex
$ dvipdfmx -f ./texfonts.map extended_abstract.dvi
Click to see An Extended Abstract of a Master Thesis.
Conclusion
Do not use Microsoft WORD when you prepare reports or papers. Use LaTeX!
Exercise
Download cis-abstract-thesis.zip and prepare your report/paper/extended abstract/thesis with LaTeX.